The year 2026 has arrived, and the digital landscape is no longer just "data-rich"; it is data-saturated. Every click, sensor reading, customer interaction, and transaction generates a digital footprint that accumulates into massive datasets. Yet, despite this abundance, a critical paradox persists: organizations are drowning in data but starving for wisdom. The sheer volume of information available today means that raw data alone holds almost zero value until it is meticulously processed, contextualized, and transformed.
In the current business climate, the competitive edge does not belong to the company with the most terabytes of storage, but to the one that can most rapidly convert that storage into actionable insights. As we navigate the complexities of an AI-driven economy, the ability to distinguish between mere observation and strategic foresight is the defining skill for leaders. This guide explores the definitive methodology for turning chaotic raw inputs into clear, decision-ready intelligence, leveraging the latest tools and frameworks available in 2026.
The Critical Distinction: Data vs. Analytics vs. Insights
Before diving into the mechanics of transformation, it is essential to clarify the terminology that often gets conflated in boardrooms and strategy sessions. Understanding the hierarchy from data to insights is the first step toward operationalizing your information assets.
Defining the Raw Material
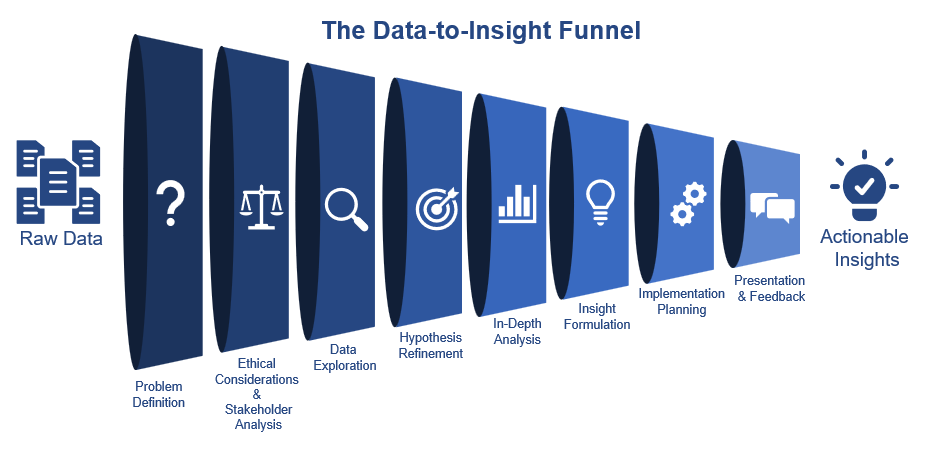
Raw data represents the unprocessed facts. It is the digital equivalent of crude oil or unrefined ingredients like flour, eggs, and sugar. On its own, a row in a database, a log file from a server, or a timestamp on a website visit tells you very little. It is often messy, incomplete, inconsistent, and devoid of context. Without intervention, raw data remains overwhelming and unusable, serving only as a potential resource rather than an active asset.
The Role of Analytics
Data analytics is the engine room where the processing happens. It involves the systematic application of statistical techniques, machine learning models, and logical reasoning to clean, organize, and examine the raw data. Analytics answers the question, "What is happening?" or "Why did it happen?" It identifies patterns, correlations, and anomalies within the dataset. However, analytics is still a process, not necessarily an outcome. You can have perfect analytics that result in a beautiful chart which still fails to tell a manager what to do next.
The Power of Actionable Insights
Data insights are the final, valuable product. They are the conclusions derived from analysis that provide context, meaning, and a clear path forward. An insight answers the question, "What should we do about it?" For revenue teams, an insight isn't just a report showing declining sales; it is the realization that enterprise opportunities in a specific region have longer sales cycles due to new regulatory changes, prompting an immediate reallocation of resources. As industry experts note, insights are not dashboards or isolated observations; they are decision-ready findings that drive strategic shifts in segmentation, budget allocation, and market positioning.
)
Why Data Insights Matter More Than Ever in 2026
The urgency to master data transformation has never been higher. In 2026, the market dynamics have shifted due to several converging trends that make traditional intuition-based decision-making obsolete.
The Velocity of Market Change
Market conditions in 2026 shift at unprecedented speeds. Consumer behaviors evolve overnight, supply chains face dynamic disruptions, and competitor strategies adapt in real-time. Companies that rely on monthly reports are already behind by the time the data is reviewed. Winning organizations now operationalize insights across sales, marketing, and product teams in real-time. This agility allows them to refine territory designs, pivot marketing spend, and adjust pricing strategies before competitors even realize a trend has emerged.
The Cost of Inaction
The cost of ignoring data or misinterpreting it has skyrocketed. Acting on poor-quality records or "gut feelings" without data backing can lead to catastrophic errors, comparable to a pilot flying with a faulty altimeter. In industries like healthcare, logistics, and finance, the stakes involve not just lost revenue but significant operational risks. Conversely, companies that successfully transform their data can catch a sales drop before it impacts revenue, flag shipment delays before they become complaints, and restock inventory before items sell out.
The Rise of Insight-Led Go-To-Market Strategies
Modern Go-To-Market (GTM) teams are increasingly defined by their ability to leverage insight-led strategies. It is no longer enough to simply collect signals across accounts and campaigns. The differentiator is the ability to synthesize these signals into a coherent narrative that guides the entire organization. Whether it is identifying which markets to prioritize or determining which customer segments deserve more investment, data insights provide the clarity needed to cut through the noise of a crowded marketplace.
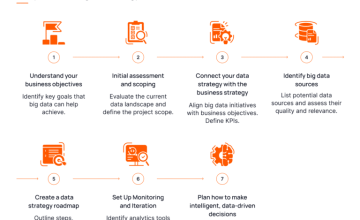
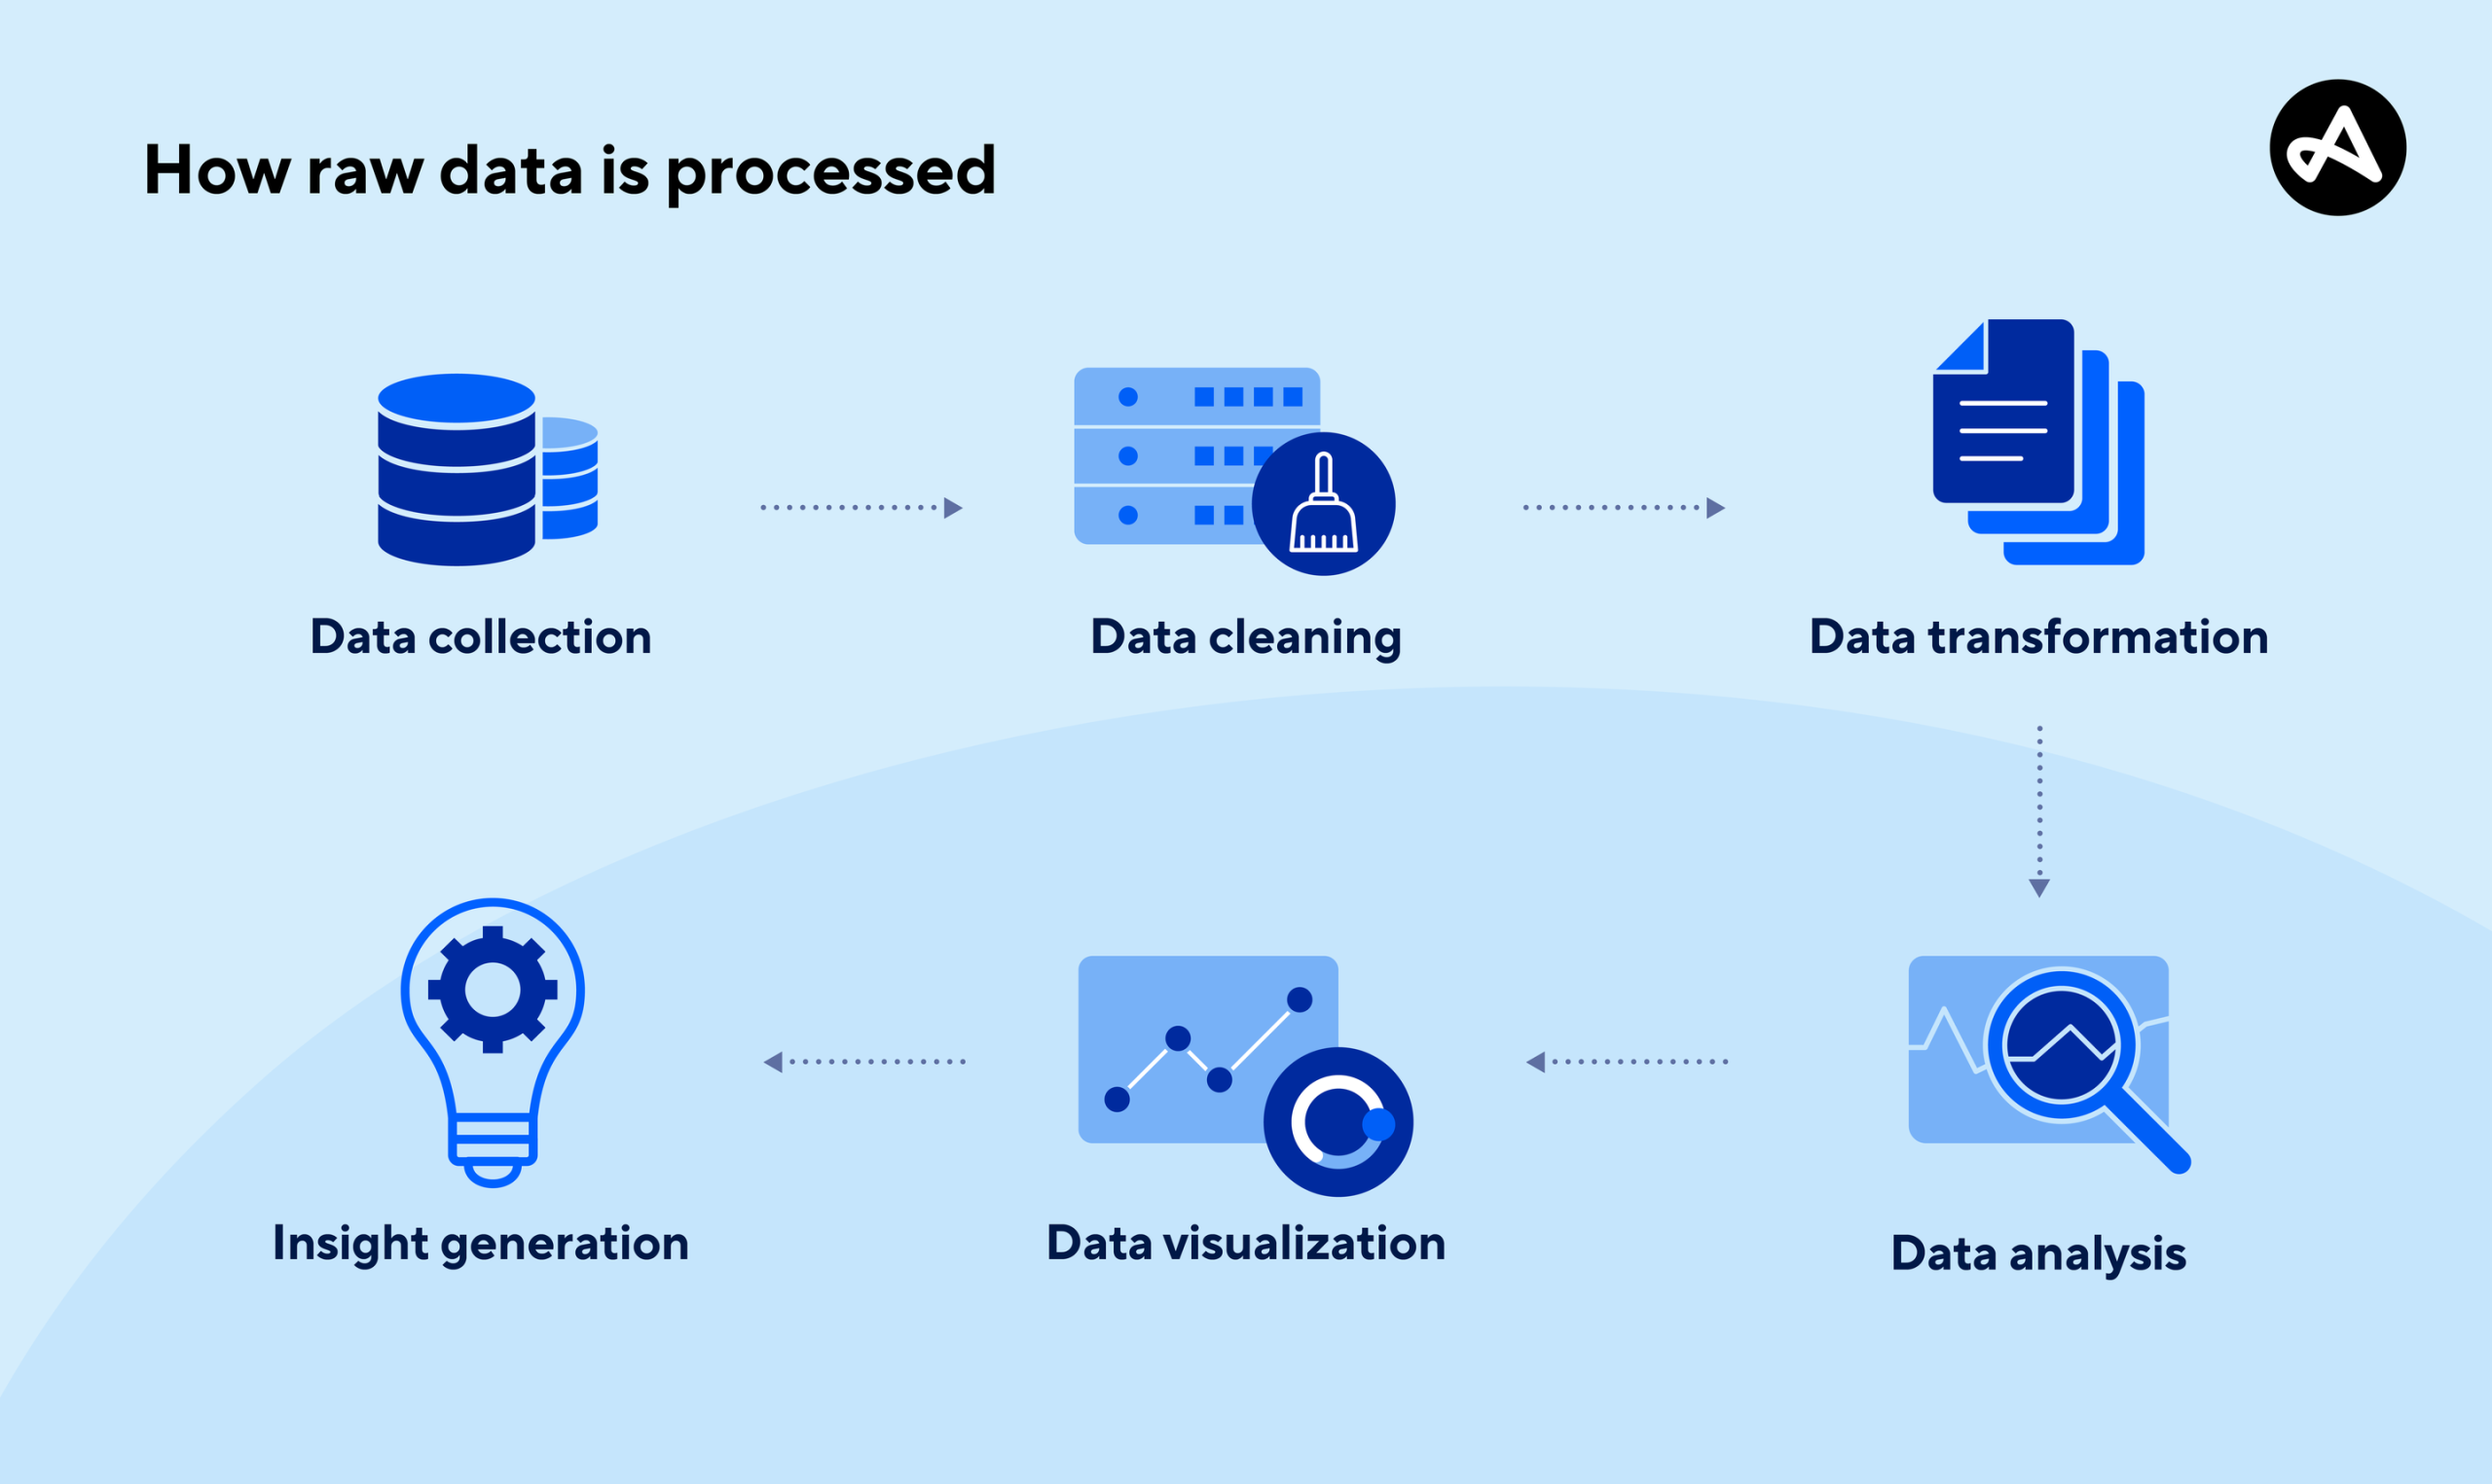
The 2026 Step-by-Step Framework for Data Transformation
Transforming raw data into useful insights is not a magical event; it is a disciplined, repeatable process. By following a structured workflow, businesses can ensure that their data initiatives yield tangible results. This framework integrates the best practices of data engineering with modern AI capabilities.
Step 1: Define Clear Strategic Objectives
The journey begins long before any data is touched. You must establish clear objectives that align with your broader business goals. Are you aiming to increase customer retention, optimize operational efficiency, or penetrate a new market segment? Without a defined target, data analysis becomes a fishing expedition that yields interesting but irrelevant findings.
- Action Point: Set SMART goals (Specific, Measurable, Achievable, Relevant, Time-bound). For instance, instead of "improve sales," aim to "increase enterprise deal closure rates by 15% in the EMEA region by Q4 2026." This focus dictates exactly which data points matter.
Step 2: Collect and Consolidate Relevant Data
Once objectives are set, the next phase is gathering the right data. In 2026, data sources are incredibly diverse, ranging from internal CRM systems and sales records to external social media interactions, IoT sensor streams, and third-party market research.
- Internal Sources: Sales transactions, customer support logs, employee databases, and website analytics.
- External Sources: Competitor pricing data, industry reports, social sentiment analysis, and economic indicators.
- IoT and Sensors: Real-time feeds from smart devices, wearables, and industrial machinery.
The key here is integration. Data often lives in silos, making a holistic view impossible. Use modern data integration tools to consolidate these disparate sources into a single, accessible location, such as a cloud data warehouse or a unified data lake. Ensure the data collected is accurate, complete, and up-to-date.
Step 3: Clean and Prepare the Data
This is often the most labor-intensive yet critical step. Raw data is notoriously messy. It contains duplicates, missing values, formatting inconsistencies, and outright errors. If you analyze dirty data, your insights will be flawed—a principle known as "garbage in, garbage out."
- Data Cleaning: Remove duplicates, handle missing values through imputation or deletion, and standardize formats (e.g., ensuring all dates follow the same convention).
- Data Validation: Cross-reference data points to ensure accuracy.
- Automation: Leverage AI-powered data cleaning tools to automate repetitive tasks. Create a checklist of common issues to monitor regularly.
Investing time here ensures the reliability of your subsequent analysis. A spreadsheet showing daily sales figures is just data; a cleaned, standardized dataset ready for comparison is the foundation of truth.
Step 4: Explore and Analyze the Data
With clean data in hand, you can begin the exploration phase. Exploratory Data Analysis (EDA) is a creative and investigative process where you look for patterns, trends, and relationships.
- Visualization: Use charts, graphs, heatmaps, and scatter plots to visualize the data. Visual representations make complex patterns immediately apparent to the human eye.
- Statistical Summaries: Calculate means, medians, standard deviations, and correlations to understand the distribution of your data.
- Hypothesis Testing: Formulate hypotheses based on initial observations and test them statistically.
This stage helps you understand the "shape" of your data and directs your deeper analytical efforts. It transforms abstract numbers into a visual story that highlights key trends and anomalies.
Step 5: Apply Advanced Analytics and AI
In 2026, basic descriptive analytics is table stakes. To gain a true competitive advantage, you must apply advanced analytics techniques, including predictive modeling and prescriptive analytics.
- Machine Learning Models: Deploy algorithms to predict future outcomes based on historical data. For example, predicting which leads are most likely to convert or forecasting inventory demand.
- Generative AI Integration: Utilize Large Language Models (LLMs) and AI assistants (like Copilot in Excel or Power BI) to summarize vast datasets, detect subtle trends, and generate natural language explanations of complex findings.
- Feature Engineering: Transform raw variables into meaningful features that improve model performance.
This step moves you from understanding what happened to predicting what will happen and recommending what should be done.
Step 6: Synthesize and Operationalize Insights
The final step is translating analytical findings into actionable business strategies. An insight is only useful if it drives action. This involves packaging the findings into a compelling narrative that stakeholders can understand and act upon.
- Contextualization: Frame the data within the specific business context. Explain why the trend matters.
- Recommendation: Provide clear, specific recommendations. Instead of saying "churn is up," say "churn is up among small businesses due to price sensitivity; recommend a targeted retention discount campaign."
- Operationalization: Integrate these insights directly into workflows. Automate alerts, update CRM fields, or trigger marketing campaigns based on the insights.
As noted by industry leaders, the goal is not just to report on observations but to embed these insights into the daily operations of sales, marketing, and product teams in real-time.
Essential Tools and Technologies for 2026
The landscape of data tools has evolved significantly. In 2026, the barrier to entry for high-level data analysis has lowered thanks to AI democratization, while enterprise-grade capabilities have become more robust.
AI-Enhanced Spreadsheets and Business Intelligence
Tools like Microsoft Excel with Copilot and Power BI have revolutionized how users interact with data. These platforms now allow users to ask questions in natural language and receive instant visualizations and trend analyses. You no longer need to be a coding expert to uncover hidden patterns; AI handles the heavy lifting of data transformation and modeling, allowing business users to focus on interpretation.
Cloud Data Warehouses and Lakes
For handling massive volumes of data, cloud-native solutions remain indispensable. Platforms that offer scalable storage and compute power enable organizations to process petabytes of data in seconds. These systems support the consolidation of data from multiple sources, providing a "single source of truth" for the entire organization.
Specialized Data Integration and Cleaning Software
Automated tools for ETL (Extract, Transform, Load) processes are critical for maintaining data hygiene. Modern solutions offer drag-and-drop interfaces and AI-driven error detection, making the tedious task of data preparation efficient and reliable. These tools ensure that data flows smoothly from source to insight without manual bottlenecks.
Python and SQL for Custom Analysis
Despite the rise of no-code tools, Python (with libraries like Pandas) and SQL remain the backbone of custom data science work. For organizations with unique requirements or complex modeling needs, these languages offer unparalleled flexibility and power. They allow data scientists to build bespoke models that off-the-shelf software cannot replicate.
Best Practices for Extracting High-Value Insights
To maximize the return on your data initiatives, consider these expert-endorsed best practices that separate successful data cultures from struggling ones.
Establish a Repeatable Data Methodology
Don't treat data analysis as a one-off project. Develop a standardized methodology that can be repeated across different departments and use cases. This ensures consistency in how data is collected, cleaned, and interpreted, making insights comparable over time.
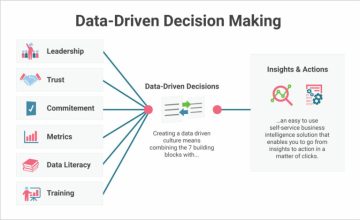
Foster a Data-Driven Culture
Technology alone cannot solve data challenges; people must embrace them. Encourage a culture where decisions are backed by evidence rather than hierarchy or intuition. Train teams across the organization—not just data scientists—to understand basic data literacy and how to interpret insights relevant to their roles.
Focus on Quality Over Quantity
It is tempting to collect every possible data point, but more data is not always better. Focus on data relevance and quality. A smaller, cleaner, and more relevant dataset will yield better insights than a massive, noisy one. Regularly audit your data sources to ensure they continue to align with your strategic objectives.
Iterate and Refine
Data insights are not static. As market conditions change and new data becomes available, your models and interpretations must evolve. Treat your data strategy as an iterative process. Continuously test your assumptions, refine your models, and update your insights to reflect the current reality.
Real-World Applications: Turning Theory into Practice
Let's look at how these concepts play out in real-world scenarios across different industries in 2026.
Revenue Operations and Sales
In the realm of sales, raw data might show a list of closed deals and their values. By applying the transformation framework, a RevOps team can uncover that enterprise deals in the German market are taking 20% longer to close due to specific compliance checks. The actionable insight leads to a redesign of the sales playbook for that region, allocating more time for legal review upfront, thereby accelerating the overall cycle time.
Supply Chain and Logistics
A logistics company collects millions of sensor readings from its fleet. Raw data shows temperature fluctuations and GPS coordinates. Through advanced analytics, the company identifies a pattern where specific routes experience delays during certain weather conditions. The insight allows them to proactively reroute shipments and adjust delivery windows, preventing customer complaints and reducing fuel costs.
Customer Experience and Retention
An e-commerce platform analyzes clickstream data, purchase history, and customer support tickets. The analysis reveals that customers who contact support regarding shipping delays within 24 hours of purchase have a 40% higher churn rate. The insight prompts the implementation of an automated proactive communication system that updates customers on shipping status before they even ask, significantly improving retention rates.
Frequently Asked Questions (FAQ)
Q: What is the biggest mistake companies make when trying to turn data into insights?
A: The most common mistake is skipping the data cleaning and preparation phase. Many organizations rush to visualize raw data without addressing inconsistencies, missing values, or errors. This leads to misleading conclusions and poor decision-making. Remember, the quality of your insight is directly dependent on the quality of your input data.
Q: Do I need a team of data scientists to generate useful insights in 2026?
A: Not necessarily. While data scientists are crucial for building complex models, the rise of AI-powered tools and user-friendly business intelligence platforms has democratized data analysis. Business users can now generate significant insights using natural language queries and automated visualization tools. However, for highly specialized or predictive modeling, expert guidance remains valuable.
Q: How often should we update our data insights?
A: The frequency depends on the velocity of your business environment. In fast-moving sectors like retail or tech, real-time or daily insights may be necessary. For more stable industries, weekly or monthly reviews might suffice. The key is to align the update frequency with the speed at which your market conditions change and the urgency of your decision-making needs.
Q: How can we ensure our insights are actually acted upon?
A: To ensure actionability, insights must be contextualized and integrated into workflows. Don't just send a report; present a clear recommendation tied to a specific business goal. Furthermore, automate the operationalization of insights where possible, such as triggering alerts or updating CRM records automatically, so the insight directly influences daily activities.
Conclusion
In the dynamic landscape of 2026, the ability to turn raw data into useful insights is not just a technical capability; it is a strategic imperative. The journey from chaotic numbers to clear, actionable intelligence requires a disciplined approach: defining clear objectives, collecting relevant data, rigorously cleaning and preparing it, exploring patterns, applying advanced analytics, and finally, synthesizing findings into strategic actions.
Organizations that master this process will find themselves ahead of the curve, capable of anticipating market shifts, optimizing operations, and delivering superior customer experiences. Those that fail to transform their data will remain stuck in the past, overwhelmed by noise and unable to see the signal. As we move forward, remember that data is merely the ingredient; your methodology, tools, and strategic vision are the recipe that turns it into the gold of business success. Start your transformation today, and unlock the full potential of your data assets.
References
- Data Insights — How to Turn Raw Data Into Better Business Decisions, 2026
- Abmatic — Raw data to actionable insights: 2026 step-by-step guide, 2026
- CodeGrape Community Blog — How Data Analytics Turns Raw Data into Useful Insights, 2025
- Databox — Data Insights: Best Practices for Extracting Insights from Data, 2026
- Digiteum Services — From Raw Data to Actionable Insights: Data Transformation Process, 2025
- SLM (Self Learning Material) — Transforming Raw Data into Insightful Information for Business Decision-Making, 2026
- Learnomate Technologies — Understanding the Data Analysis Process: From Raw Data to Actionable Insights, 2025